The Stats tab
Advanced Edition
The Stats tab does linear regression and full summary statistics from data you type or load from a file, with plots underneath. Quick answers are already available inline: mean, median, standardDeviation, quartile1, quartile3 and more work on a list in any cell.
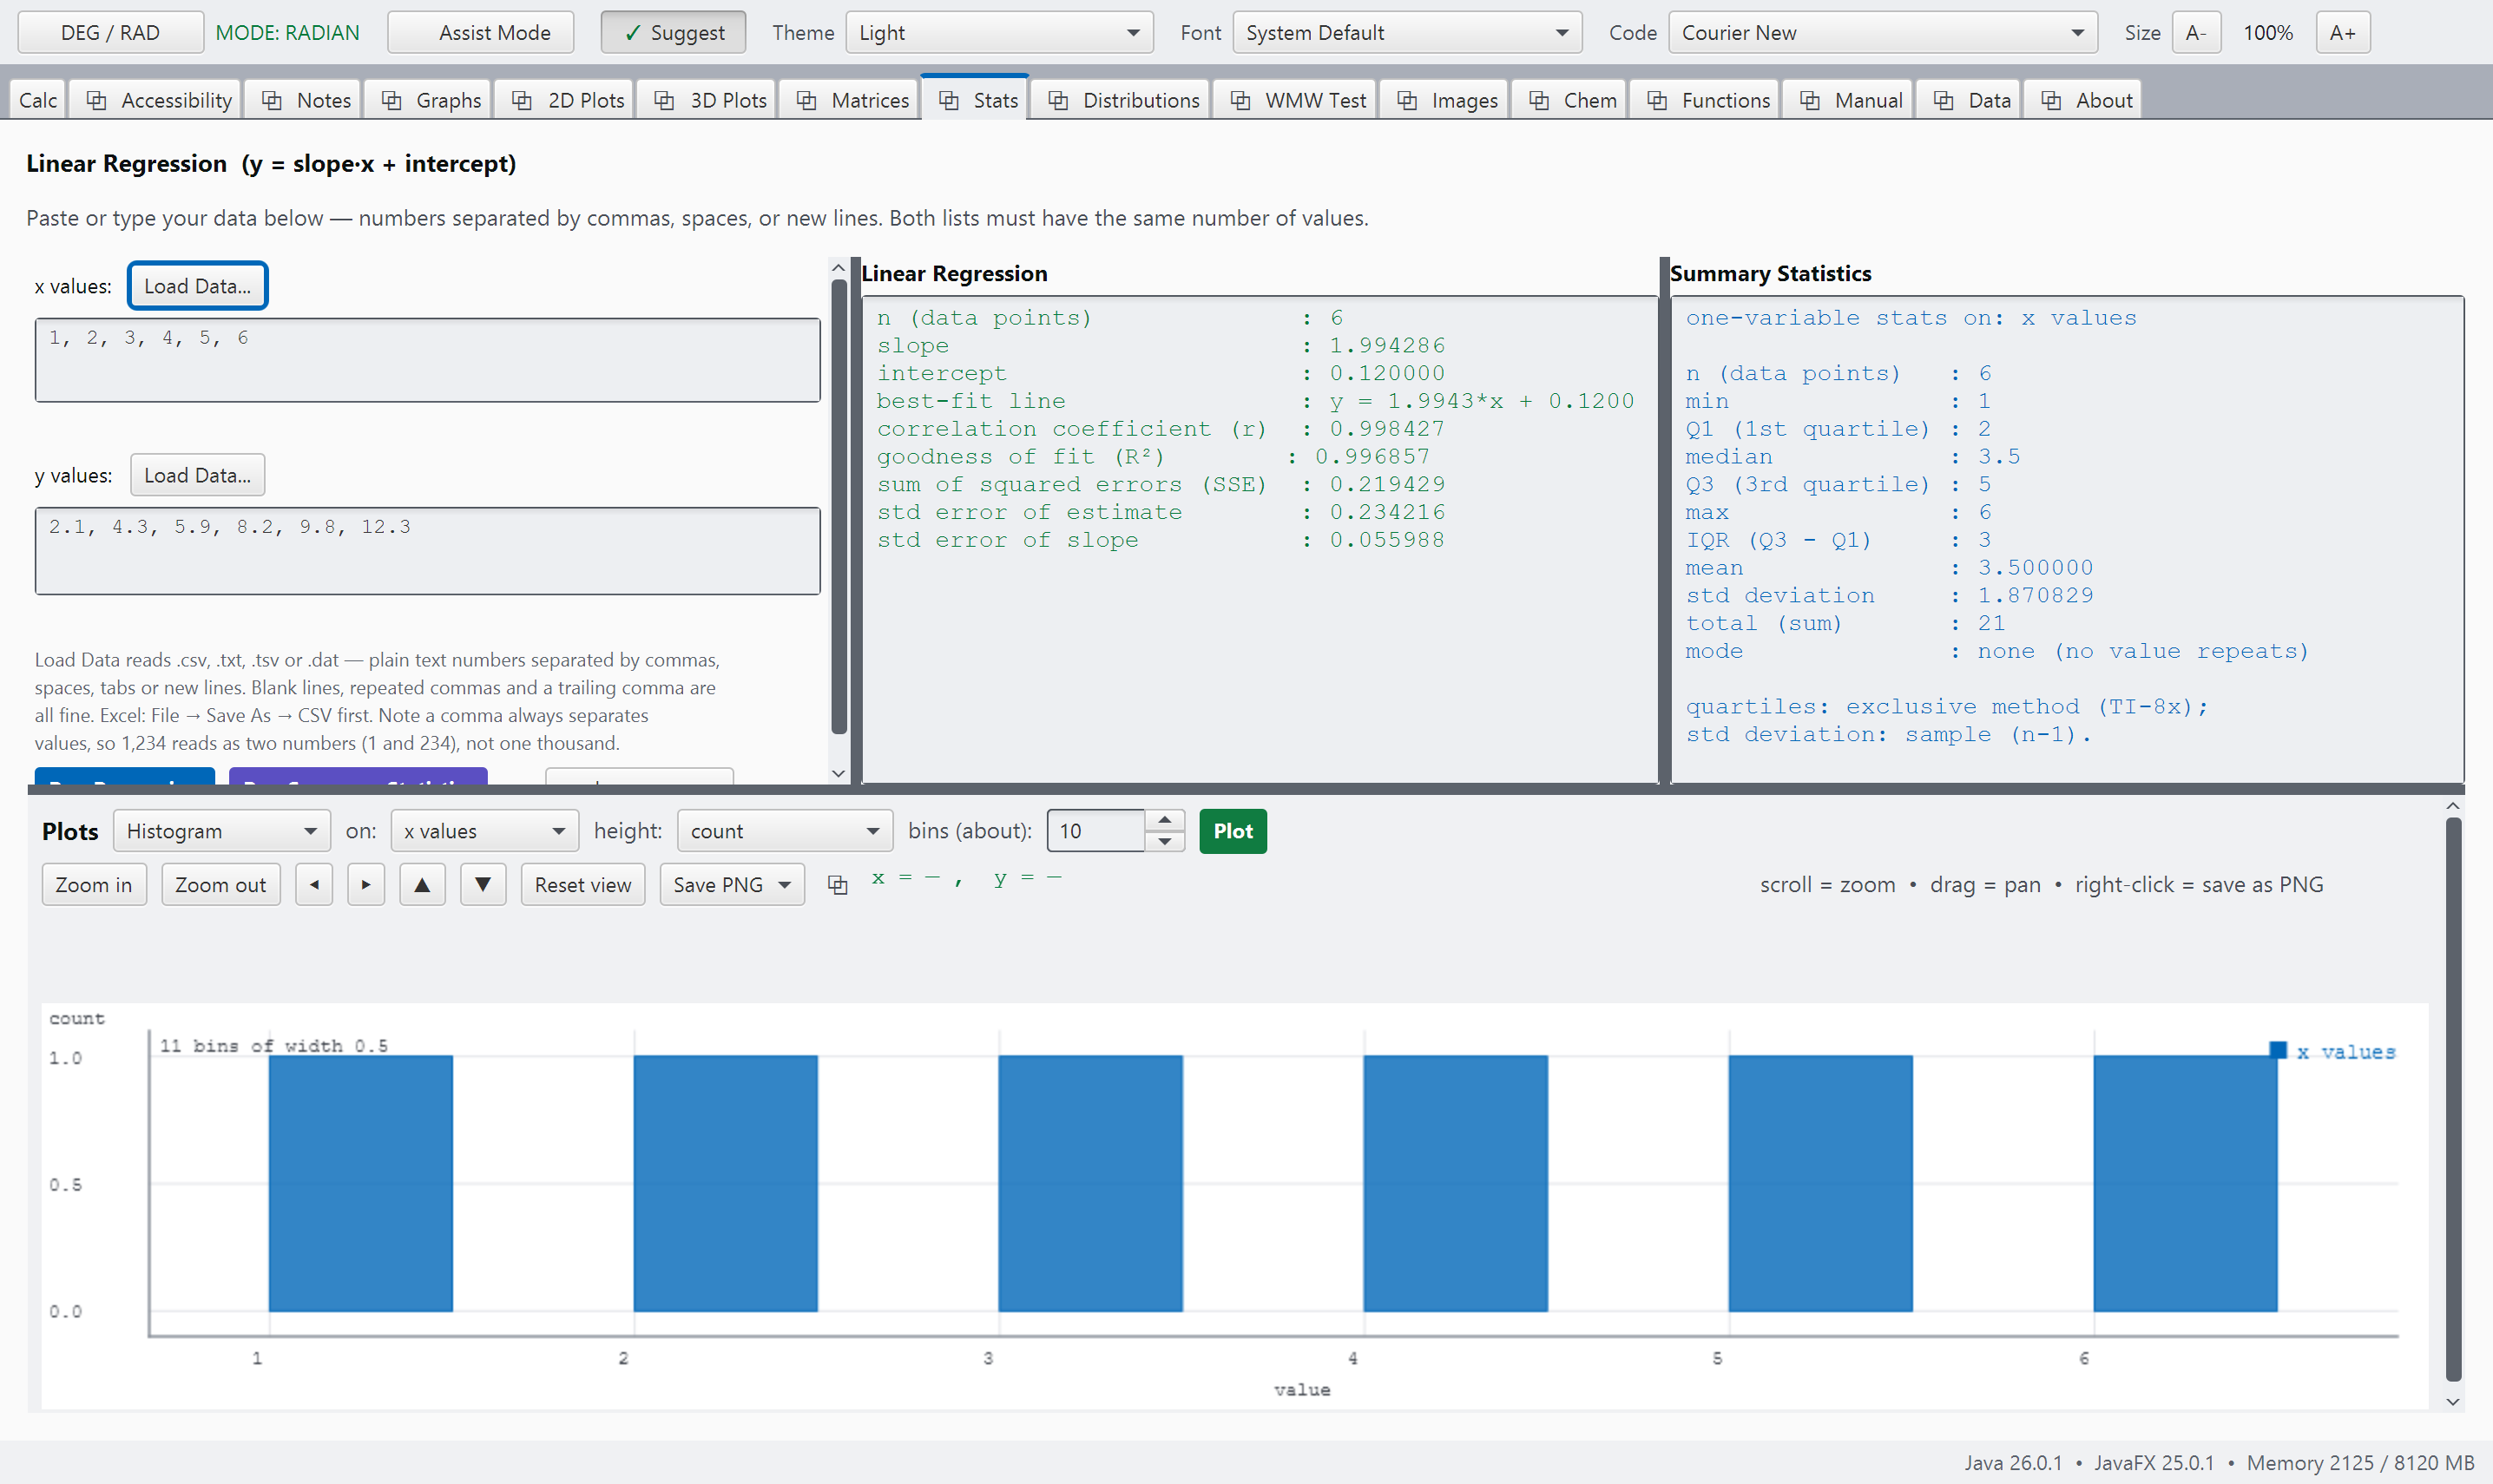
statistics.pngStats, a dataset loaded with its plot showing.
Typed in, answered back
Every example here has been run and tested.
These are not merely illustrations; they are carefully verified examples drawn directly from the system's own reference. Every example is automatically tested, and the build will stop if even one result has changed unexpectedly. That gives us something important as teachers and scientists: a reliable connection between what we see in the manual and what the system actually does. When an example is included here, you can trust that it has been tested and works as described.
Statistics you can type anywhere
This is the sample standard deviation, which divides by n-1. The same call also accepts a single list.